Most CRM dashboards are stuck in the past. They show you what has already happened. Numbers go up or down, charts get more colorful, but no one knows what to do next. That is the reporting trap.
The real value of a CRM dashboard lies not in what it reports, but in what it reveals. When built correctly, dashboards become diagnostic tools. A diagnostic CRM dashboard acts like an X-ray machine for your revenue engine. They reveal where deals stall, where leads are lost, and what actions drive outcomes.
Let’s break down how to stop reporting, start diagnosing, and transform your CRM dashboards into decision-making engines that drive measurable results.
The Difference Between Reporting and Diagnosing
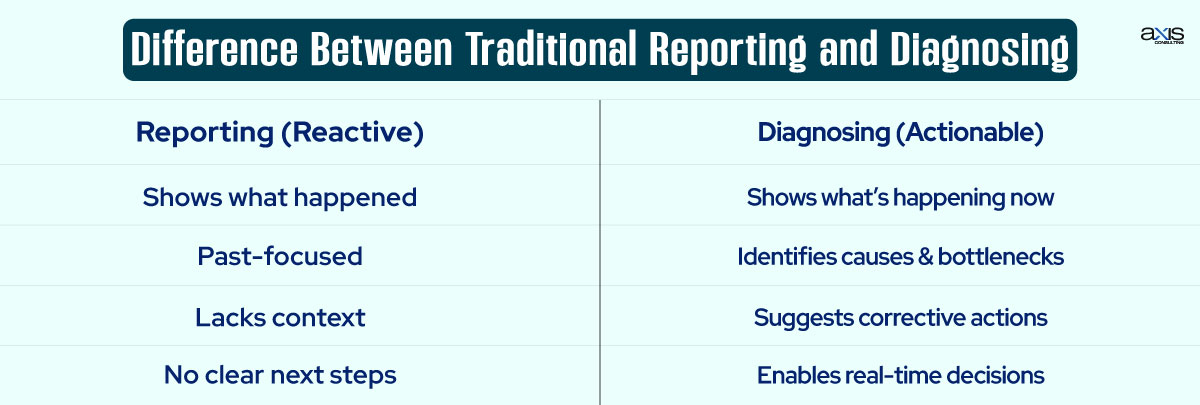
Traditional reports in CRM platforms, such as Salesforce, HubSpot, Zoho, and Microsoft Dynamics 365, often focus on the past. They tell you what happened in the last week, last month, or last quarter.
The problem? Business moves in real time. By the time you react to what happened last month, the opportunity to fix the problem is gone.
A real-time CRM dashboard solves this. It shows you what’s happening now, why it’s happening, and what to do about it. Think of it as the difference between checking yesterday’s weather versus seeing live radar before you leave the house. One is informational; the other is actionable.
Why Traditional CRM Reporting Falls Short in Modern Business Environments?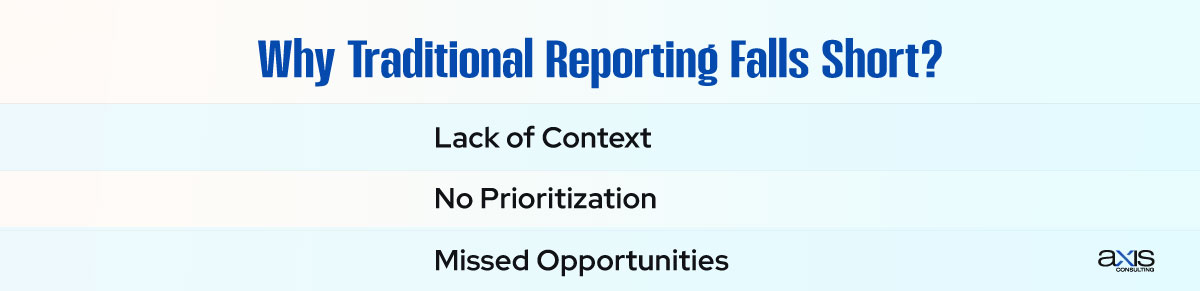

Most CRM reporting tools are reactive. They inform you that a change occurred, a drop in pipeline value, a dip in conversion rates, or a spike in churn, but they don’t tell you why.
Here’s why static reporting fails:
Lack of context: A number without a story is useless. If revenue dropped 15%, was it because of stalled deals, poor lead quality, or seasonal trends?
No prioritization: Dashboards often fail to highlight which problems need immediate attention.
Missed opportunities: Without identifying root causes, you can’t act quickly enough to fix performance leaks.
This is why data-driven decision-making now depends on moving from reporting to diagnosing.
Build a Decision-Driven CRM Dashboard
To create a dashboard that diagnoses problems and prompts action, you need more than vanity metrics. Combine metrics with behavior and motion. You are not just tracking performance; you are identifying patterns and predicting issues.
Rethink what belongs on your dashboard. Instead of showing total revenue or the number of leads, ask better questions. Are deals moving efficiently through the pipeline? Which campaigns are generating qualified leads, not just traffic? Are reps following up in time? Where does follow-through break down? Which customer issues are repeating? How fast are they being resolved?
The more your dashboard can connect metrics to real-world behavior, the more valuable it becomes.
Diagnose Sales Bottlenecks with CRM Dashboards
In sales, speed and visibility are critical. A monthly report showing close rates might seem fine. But look closer, and you might discover most deals are stuck in the same stage of the pipeline.
A diagnostic sales dashboard reveals average time in each stage, touchpoints by deal owner, stalled deals without activity, and win rates by lead source or persona.
By combining this information, sales managers can pinpoint where momentum is lost, where lead quality is weak, or where reps need support. Now you are not just seeing that sales dropped. You can see why and what needs to be fixed.
Turn Marketing Reports into Conversion Diagnoses
Marketing teams often rely on vanity metrics, such as impressions, clicks, or email open rates. However, these rarely directly connect to closed deals. Diagnostic dashboards for marketing focus on the buyer journey and conversion quality.
Track how leads move from awareness to decision. Look at lead-to-MQL conversion rates. Analyze MQL-to-SQL transitions by campaign or content type study, which pieces of content influence deals, and which touchpoints generate pipeline momentum.
This approach enables you to identify what works and what wastes time. A high-traffic landing page that generates no qualified leads is ineffective. It is a signal to adjust your targeting or message.
Use Dashboards to Improve Customer Experience
Your CRM dashboard should extend beyond sales and marketing to encompass the entire organization. The post-sale experience matters as much. A good diagnostic dashboard includes customer service and success data, enabling you to proactively address problems before they escalate.
Include support ticket volume by issue type, average resolution time, CSAT, and NPS by category, and onboarding progress by customer segment.
This turns your dashboard into an early warning system. You can identify where satisfaction levels drop, which issues are recurring, and which accounts are at risk of churning. That lets you act early and protect long-term revenue.
Key Elements of a Diagnostic CRM Dashboard
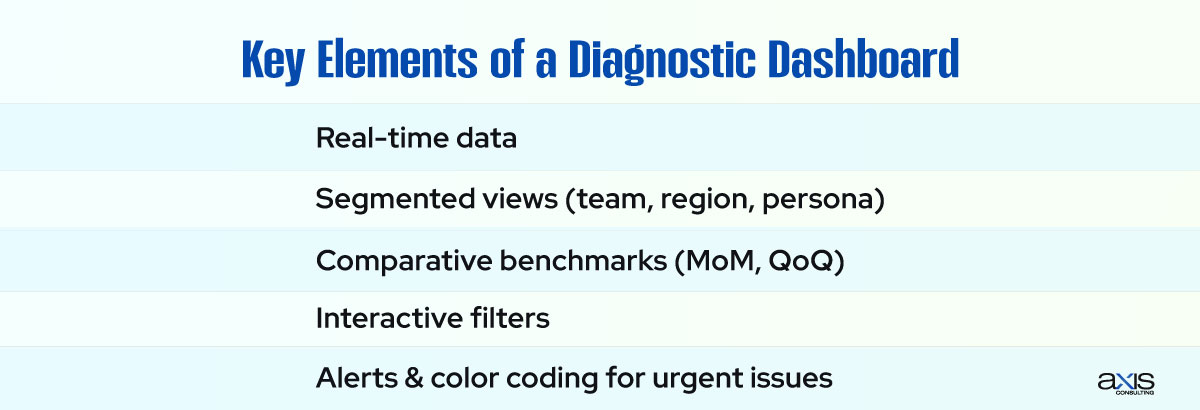
If you want your dashboard to guide decision-making, it needs several essential features.
First, it must offer real-time data. Reports from last week are no longer useful today. Second, it should provide segmented views. This means breaking data into functional layers, such as by team, region, or customer persona.
Next, comparative benchmarks are vital. Monthly or quarterly comparisons show whether trends are improving or slipping. Interactive filters also help users dig into the data that matters most to their role.
Finally, your dashboard should include alerts or color-coded visuals to flag urgent issues. This ensures that teams not only review the data, but also act on it.
How to Align Dashboards with Team Roles?
Not everyone in your company needs to see the same data. Tailoring dashboards by role ensures each team gets what they need to make faster, smarter decisions.
A sales rep needs to track active deals, upcoming tasks, and lead scoring. Their manager needs pipeline health, forecast accuracy, and rep activity metrics.
Marketing wants to see campaign performance, lead quality by source, and engagement by channel. Service teams focus on support volume, customer feedback, and resolution time. Customize dashboards to support the unique workflows of each team. That increases adoption and drives accountability.
Avoid Common Dashboard Mistakes
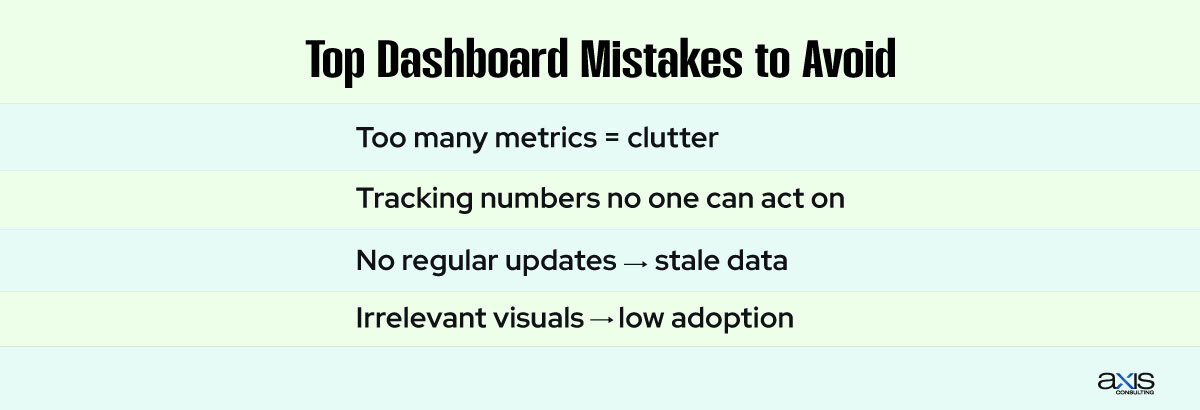
Many dashboards fail because they attempt to display too much information. Adding dozens of charts or tracking irrelevant metrics creates clutter and confusion. Stick to data that drives action and informs decisions.
Another common mistake is tracking metrics you cannot control. If no one can act on the number, it does not belong on your dashboard.
Also, avoid letting your dashboards become stale. Review them regularly. Update filters, replace outdated metrics, and adjust visuals to match your current strategy. Dashboards must evolve. If they do not, they become background noise instead of valuable tools.
Conclusion: Diagnose More, Guess Less
Static reports show you the past. Diagnostic dashboards show you the problem, the pattern, and the next best course of action. They connect data to action and insight to results.
Your CRM should not only track numbers, but also track relationships. It should help you make decisions faster and with greater confidence. So stop reporting. Start diagnosing. Because the best dashboards do not just inform, they guide. You can contact Axis Consulting for expert suggestions.
FAQs
What is the difference between CRM reporting and diagnosing?
Reporting tells you what happened. Diagnosing explains why it happened and what to do next, so that you can take action based on the insight.
Can any CRM support a diagnostic dashboard?
Yes. Most modern CRMs, such as Salesforce, HubSpot, and Zoho, enable the creation of custom dashboards with real-time updates, filters, and performance tracking.
How often should a CRM dashboard be updated?
You should review it monthly and refresh it quarterly. This ensures the dashboard stays aligned with goals and remains actionable.
What are the signs my dashboard needs improvement?
If your team ignores it, takes no action based on the data, or repeats the same mistakes, the dashboard is likely just reporting, not diagnosing.
How do I decide which metrics to include?
Focus on metrics tied to decisions, performance, and business outcomes. If the metric does not help guide action, remove it.